
Predicting Returns
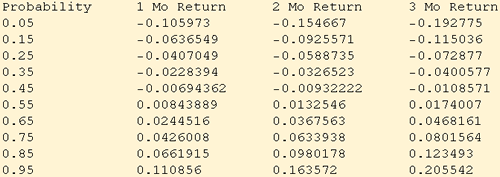
The good fit of the scaled parameters suggests that a table of probabilities based on scaled parameters from the daily data can be used to predict longer term return probabilities. The table below shows set of probabilities that a return should be less than or equal to the log-return value listed in the table at the given time interval. To obtain a probability of a greater return than the value, subtract the probability from 1. The data were calculated using the StableQuantile function for a set of parameters calculated from the last four years of the log-return data set in order to capture a more current period of volatility. The parameters were scaled to intervals of {21, 42, 63} trading days, corresponding to approximately {1, 2, 3} month intervals. A table of probabilities may be the one of the best ways to understand portfolio risk over a short future time period.
![]()