
Stable Random Generator
Some authors have rejected a stable model for stock market data based on tail behavior. For stable data the tail probabilities should scale with the proportional relationship P(X > x ) ~ a. Plerou et al. (1999) have analyzed the asymptotic tail behavior of 35 million daily records of 16,000 companies for a 35 year period and have found a calculated a in the range {2.5, 4.0} from an analysis of the tail exponent. Based on this they conclude that stock market data has tail behavior well outside the stable range of 0 < a = 2. Mathematica can be used to demonstrate that the Dow Jones data set displays the same phenomenon. The graphics below show the fit to the events in the tails of the data that are more than two standard deviations from the mean. The calculated a, from the slope of the log - log plots of tail probabilities versus the values of x, is about 3.0. The lower plots show the fits of the left and right empirical distribution curve compared with the calculated cumulative distribution based on the maximum likelihood parameter fit to the data. Tail behavior of a random sample of 26978 shows a tail size of 622 with a right tail fit of -15.371-3.0668x and a left tail fit of -14.8333-2.9903x.
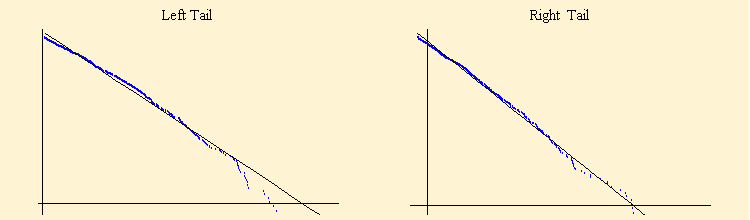
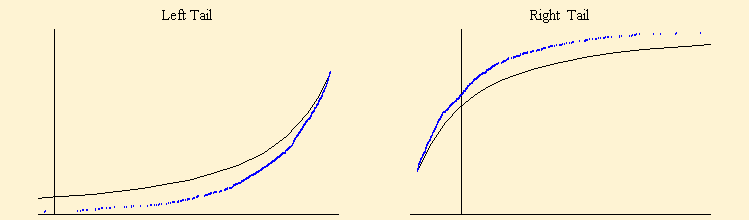
The actual data points far out on the tails clearly exhibit a tail exponent that is higher than that calculated by the fit to the data. Whether this is sufficient reason to exclude the stable model remains an open question.
![]()